PyCG 8: Audio Oscilloscope
22 Aug 2019Oscilloscope music is a very unique music genre, which is mainly developped by Jerobeam Fenderson (see the video below as an example). The idea is that you can not only listen to it, but you can also see it visually. Indeed, if you pass the audio signal into an oscilloscope, the fancy patterns cleverly designed by the artist will be revealed. This time, let us find out how to visualize the wave form given an oscilloscope music.
XY mode of oscilloscopes
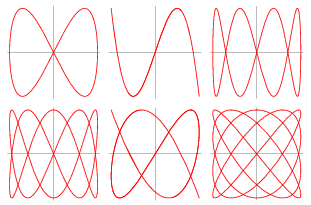
XY mode is a function provided by many oscilloscopes, where two independent input signals are put together in the output. The image of oscilloscope music can only be viewed in XY mode. How XY mode works is simple: at any given moment, the strength of signal 1 represents the x-coordinate of the point, and the strength of signal 2 represents the y-coordinate. The famous Lissajous curve can be viewed easily in XY mode, with two sine waves as inputs.

Decoding audio data
The audioread package decodes audio data into signed short arrays (int16_t). This is the sample code provided in its docummentation:
with audioread.audio_open(filename) as f:
    print(f.channels, f.samplerate, f.duration)
    for buf in f:
        do_something(buf)
The audio file is read buffer by buffer, where each buffer is a chuck of audio data of a particular size (usually 4KB). The buffer is made up of samples, and the size of each sample is number of channels times the size of audio data. In this case, because it is a stereo audio, and the data type is signed short, the size of each sample is \(2 \times 2~\mathrm{byte} = 4~\mathrm{byte}\). In each sample, the data of each channel is stored side by side. In order to make the data more Python-friendly, we can join the data into a big array and use numpy to split them into two channels, just as shown below.
import audioread
import numpy as np
import openal

audioBuffer = []

sampleRate = None
audioLength = None

soundFile = 'Jerobeam Fenderson - Planets.wav'

# load audio
with audioread.audio_open(soundFile) as inaudio:
    assert inaudio.channels == 2
    sampleRate = inaudio.samplerate
    audioLength = inaudio.duration
    for buf in inaudio:
        data = np.frombuffer(buf, dtype=np.int16)
        audioBuffer.append(data)

dataBuffer = np.concatenate(audioBuffer).reshape((-1, 2)).astype(np.float32)
Audio playback
I use the PyOpenAL package to support audio playback in the demo. My knowledge on this package is still very limited, so I am using the most basic APIs provided by the package. I think more coding is needed in order to synchronize the video and audio accurately. What is more, PyOpenAL only supports WAV format, but audioread supports all kinds of formats. There should be a way to stream decoded audio data into PyOpenAL so that the audios of other formats can be played.
The demo
After acquiring all audio data points, we can convert them into NDC and load them entirely into the graphics memory. We can use glDrawArrays to control with part of audio we would like to draw. The audio sample that I use is captured from YouTube, therefore the image generated will tend to have a lower quality. You are welcomed to buy authentic tracks from Jerobeam Fenderson to examine what they look like.
The source code ban be found on GitHub.